THREE STATES OF MATTERS:
s
SOLID
|
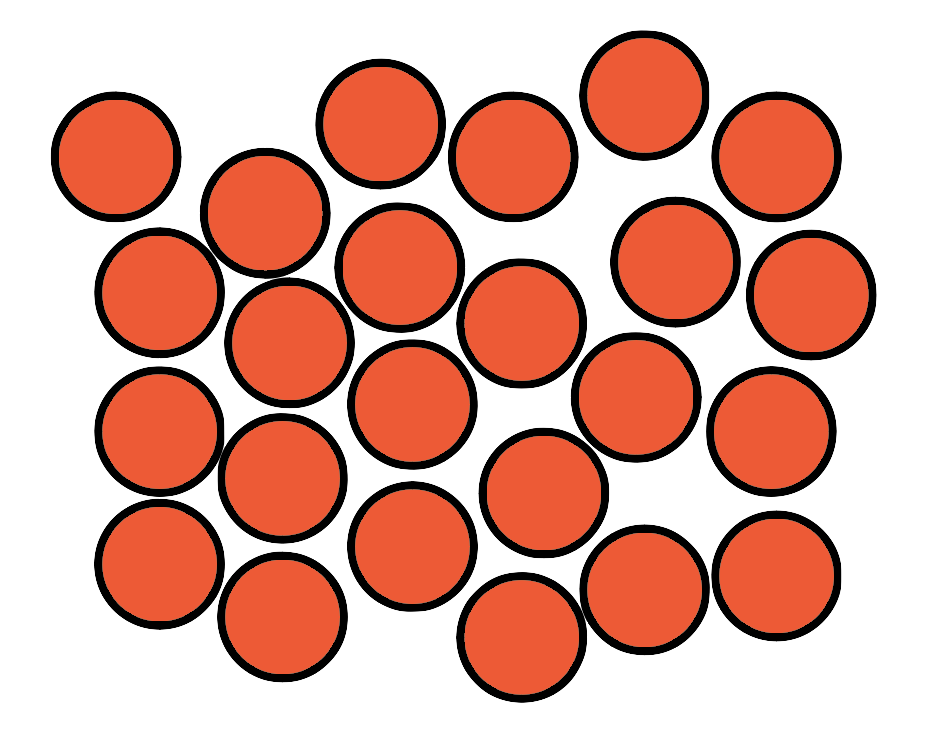
LIQUID
|
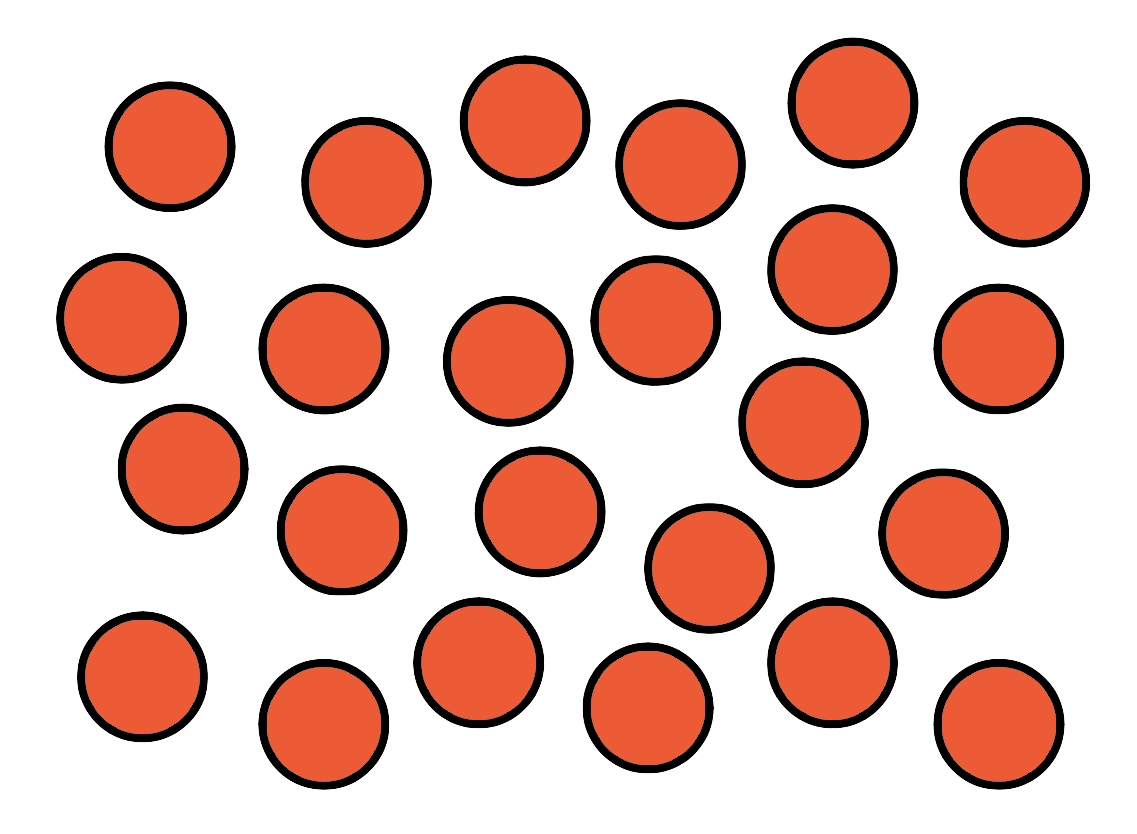
GAS
| |
DIAGRAM
|  |  |  |
ARRANGEMENT
|
Close together in regular arrangement
|
Close together in free arrangement
|
Far apart in random arrangement
|
MOVEMENT
|
Vibrate on the spot
|
Moves around each other
|
Moves quickly in all directions
|
ENERGY
|
Small amount of kinetic energy
|
Moderate amount of kinetic energy
|
Large amount of kinetic energy
|


